Develop an admission report.
1. On the “Home” tab, click “Edit” Grad Weekly Report.
2. In “Edit” mode, click “Criteria” tab.
3. Drag or double click the fields needed for the analysis from the left “Subject Areas” pane to add to the top “Selected Columns” pane.
4. Once added, drag-and-drop columns to reorder them.
5.Apply sorting on field. Please note if you already have sorted on other field(s), you need to use the “Add Ascending Sort” or “Add Descending Sort”, so that the second or more sort fields can be added (notice the sort number added next to the sorting symbol), otherwise the sort field will replace the previous sort setting.
6. Add Filters to the Analysis. Note the logical operator between the filters are “AND”, and you can click “AND” to change it to “OR”. Also pay attention to the indentation of the Filter criteria which is an indication of the grouping of the filters.
7. Save Analysis.
8. Click “Result” tab to modify layout of report results. The preliminary report is showing in the “Compound Layout” pane. Click the pen button to edit it.
9. Develop a pivot table design (most important report design). The fields selected previously on the “Selected Columns” under the “Criteria” tab are automatically plugged in the layout. You will need to make adjustments by dragging and dropping the fields to get the desired results. As you make the changes in the “Layout” pane, you will see the results on the top pane above the “Layout” pane.
9.1 Pivot Table Prompts. It gives you a report level filter for the end user to control.
Layout:
Results:
9.2. Section. It split the pivot table into sections by the value of the field selected. In the example, there will be a section for Masters programs and a section for PhD programs.
Layout:
Results:
9.3 Pivot Table Columns. Notice the “Measure Label” is on top of “Academic Year”, which means the “Academic Year” is a sub-column heading for each measurements. If the “Academic Year” is on top of the “Measure label”, then the column data for 2014 will be grouped together and 2015 data will be grouped together.
Layout:
Results:
9.4 Pivot Table Rows. For the row fields you can select to add subtotals for the measures. You can add the subtotal for the rows for the value grouping for each field (Notice the green ticket on the AutoSum symbol).
Layout:
Results:
9.5 Pivot Table Measures. These are the fields that you want to show the value and maybe also apply some calculation to show the variance or percentage change.
Layout:
Results:
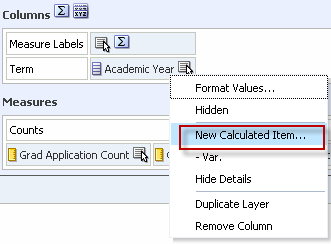
9.6 Pivot Table Calculated field. I need a field to show the difference between the 2014 number and 2015 number. Because it applies to all the columns, the calculated field can be easily set up in “Columns”. “Academic Year”
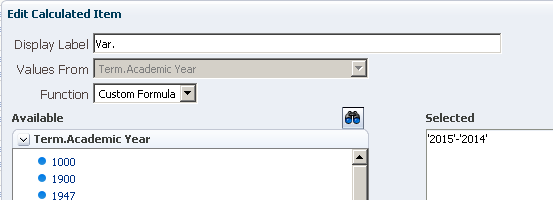
Edit Calculated Item: I gave the label “Var.” to the calculated field. The formula is ‘2015’-‘2014’. We will talk about programing for dynamic calculated field in later topics. The result is shown as the illustration above.
Click save button and you just developed a basic report using Oracle Business Intelligence.
I. A.


